

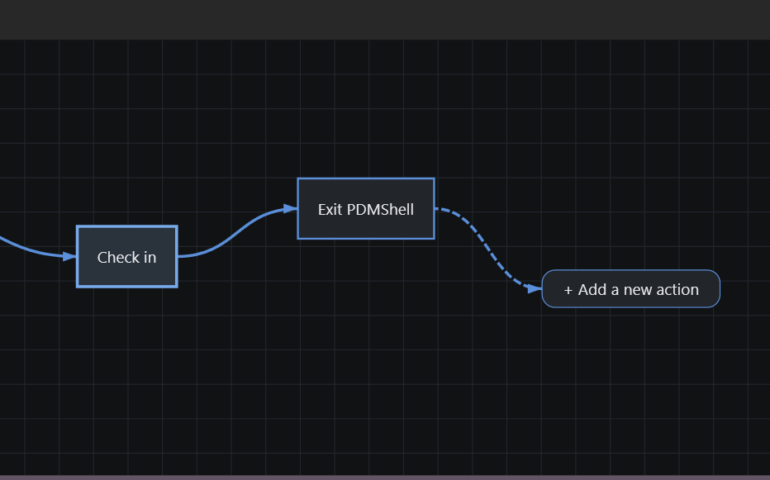
This article explains how to use PDMShell with Windows Task Scheduler to automatically check in files from a SOLIDWORKS PDM vault folder on a weekly schedule. PDMShell is a command-line tool for SOLIDWORKS PDM that allows administrator to run PDM
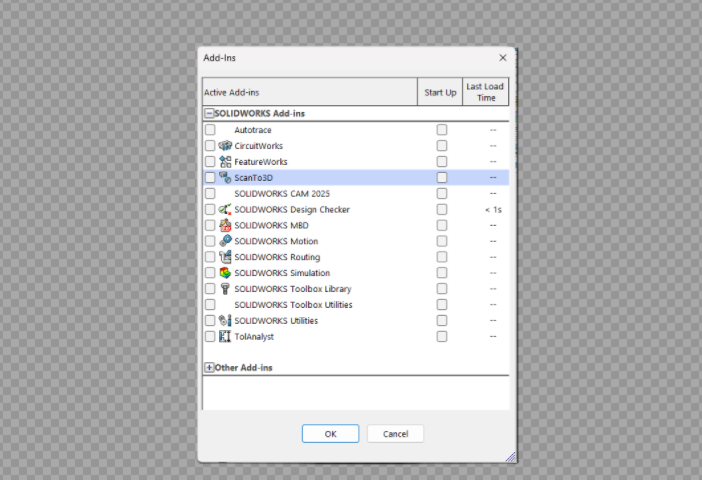
When creating a SOLIDWORKS task pane, the SOLIDWORKS API documentation says that icon transparency can be handled by using a specific background color. For CreateTaskpaneView3, the documentation explains that task pane bitmap images should use a 256-color palette, and that
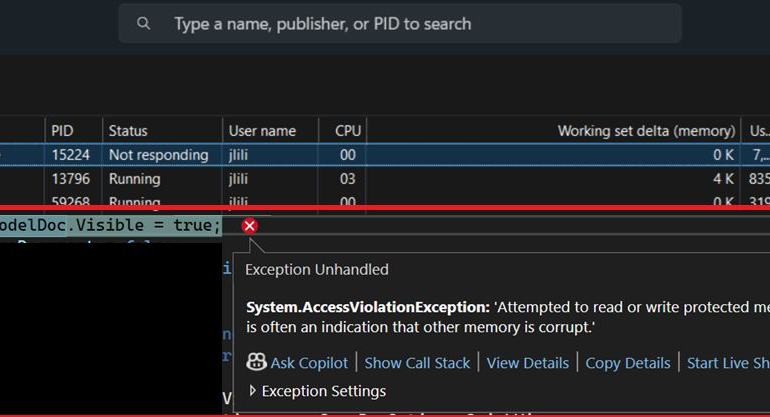
When building long-running SOLIDWORKS API tools, crashes are not always caused by high RAM usage. One of the most common causes of instability is excessive GDI object usage combined with unreleased COM objects. This often appears during batch automation jobs

Deleting a vault in SOLIDWORKS PDM is a destructive and irreversible operation. It removes the vault definition from the archive server and permanently deletes the associated database. This post walks through the correct order of operations, common prompts you’ll see,
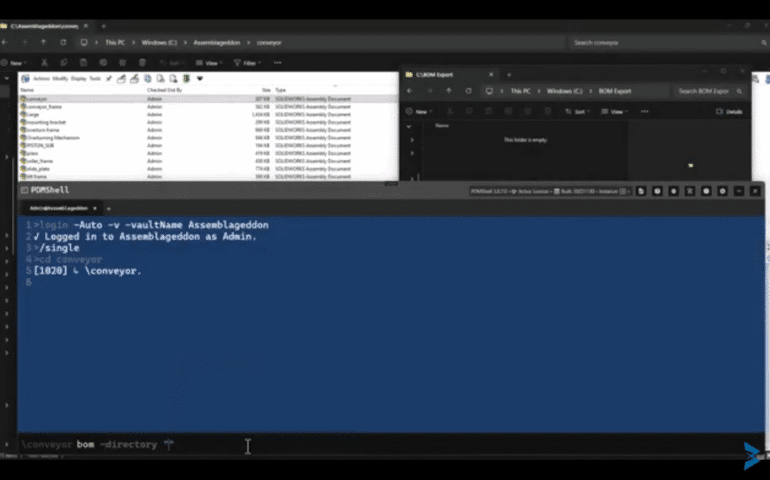
Ride of the Valkyries Alert 🎼 — Don’t listen if you don’t enjoy Wagner. When you are managing complex assemblies inside SOLIDWORKS PDM, generating a bill of materials (BOM) is a routine task, but i’s also one of the most
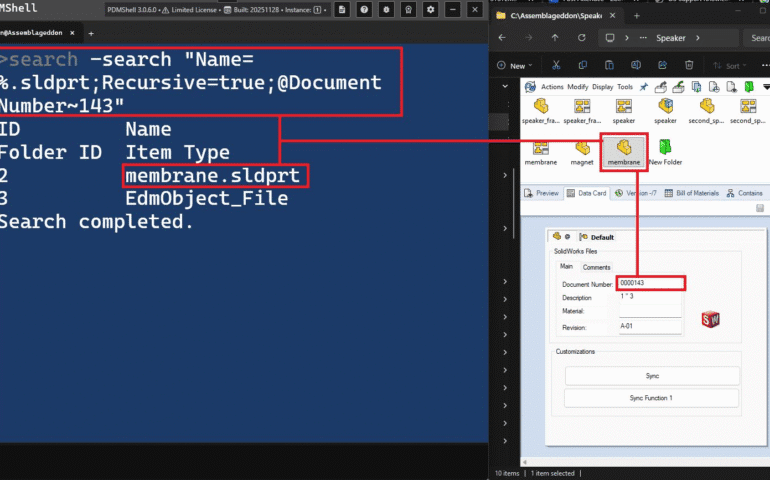
PDMShell gives SOLIDWORKS PDM administrators the ability to run precise, scriptable, and automated operations across large sets of files, and the PowerShell PDMShell search command is at the center of that capability. One of its most powerful features is the
